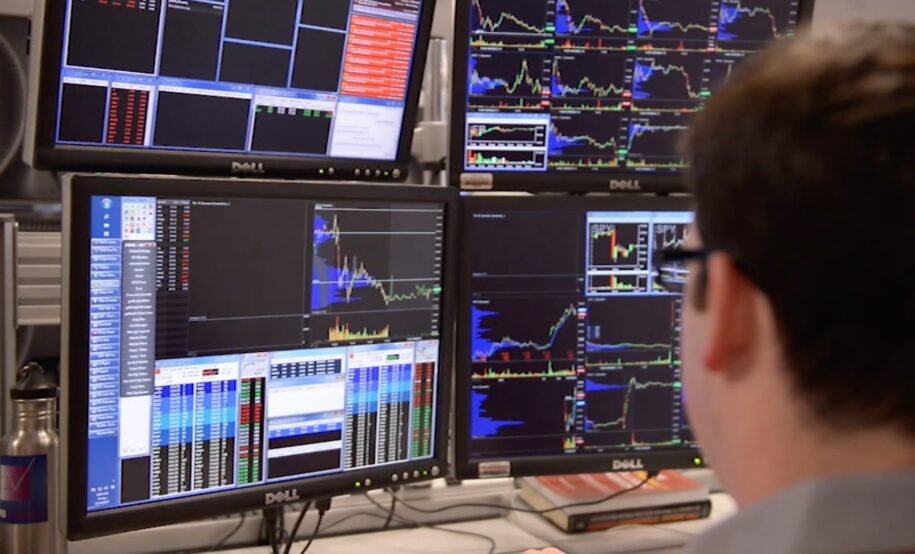
Day Trading in a Prop Firm requires precision, speed, and a deep understanding of market movements. One crucial factor that can determine success is choosing the right timeframe for your trades. Different timeframes offer unique advantages, and selecting the best one depends on your trading style, risk tolerance, and market conditions.
In this article, we’ll explore the most effective timeframes for day trading and how to use them efficiently.
Understanding Timeframes in Day Trading
A timeframe refers to the duration of each candlestick or bar on a price chart. For day traders, timeframes typically range from a few seconds to a few hours, depending on the strategy used.
The most common timeframes include:
✔ 1-Minute Chart (M1) – Best for scalpers seeking quick profits.
✔ 5-Minute Chart (M5) – Ideal for identifying short-term trends and reversals.
✔ 15-Minute Chart (M15) – A balanced option for traders looking for clear signals.
✔ 30-Minute Chart (M30) – Provides a broader view while maintaining short-term focus.
✔ 1-Hour Chart (H1) – Useful for confirming trends and setting trade setups.
Best Timeframes for Different Trading Strategies
1. Scalping – 1-Minute and 5-Minute Charts
Scalping involves making quick trades with small profit targets. Traders using this strategy focus on the 1-minute and 5-minute charts to capture small price movements. These short timeframes allow scalpers to identify rapid changes in market direction.
✔ Best for: Traders who prefer high-frequency trades with quick execution.
✔ Key indicators: Moving averages, Bollinger Bands, and RSI for identifying momentum shifts.
2. Intraday Momentum Trading – 5-Minute and 15-Minute Charts
Momentum trading relies on strong price movements in one direction. The 5-minute and 15-minute charts help traders spot breakouts, trend continuations, and volume surges.
✔ Best for: Traders who follow trends and capitalize on market momentum.
✔ Key indicators: MACD, Volume, and Trendlines for confirming trade setups.
3. Range Trading – 15-Minute and 30-Minute Charts
In range trading, traders buy at support and sell at resistance within a price range. The 15-minute and 30-minute charts are excellent for identifying key levels where price tends to reverse.
✔ Best for: Traders who prefer stable price movements without major breakouts.
✔ Key indicators: Support and resistance levels, Stochastic Oscillator, and Bollinger Bands.
4. Trend Following – 30-Minute and 1-Hour Charts
Trend-following traders look for longer-lasting price movements and use the 30-minute and 1-hour charts to identify trends and confirm entry points.
✔ Best for: Traders who prefer structured setups and longer trade durations.
✔ Key indicators: Moving Averages, ADX, and Trendlines to spot trend direction.
Choosing the Right Timeframe for You
Selecting the best timeframe for Day Trading in a Prop Firm depends on:
✔ Your Trading Style – Scalpers need lower timeframes, while trend traders benefit from higher timeframes.
✔ Market Conditions – Volatile markets work well with shorter timeframes, while calmer markets suit longer timeframes.
✔ Risk Tolerance – Lower timeframes require faster decision-making, whereas higher timeframes offer more stability.
Final Thoughts
The best timeframe for day trading varies based on individual preferences and market dynamics. Whether you choose the 1-minute chart for quick scalping or the 1-hour chart for trend confirmation, consistency and proper risk management are key to success.
By understanding different timeframes and aligning them with your strategy, you can enhance your trading performance and make well-informed decisions in the fast-paced world of day trading.


